In May I attended the BEPSII biogeochemistry sea ice school in Cambridge Bay, Nunavut, Canada. I was particularly interested to visit the sea ice at that time of year as we were about to experience the melt onset: the transition of the sea ice’s snow cover from dry to wet. I’m currently writing the final chapter of my PhD thesis on the topic of melt onset, so seeing it in person was really thought provoking. I also recently developed a floe-scale snow-depth distribution, and I was keen to model its impact on light availability in the period prior to melt onset. Finally, next year I’m planning to take some chlorophyll profiles and under-ice light measurements from landfast Antarctic sea ice, so I wanted to learn how to do this from the best.

Me looking at the ice surface that was gradually revealed over the week as the snow melted back. The ice surface was very fresh, as a result of nearby river. This fresh-ice cap overlay the more traditional, highly saline sea ice. Photo Evelyn Workman (BAS) (@efworkman96)
BEPSII (BGC exchange processes at the sea-ice interfaces) is a group of scientists that work on just that. In particular, they focus on improving observations of BGC processes, building large-scale databases of BGC data, and upscaling and incorporating processes in models. BEPSII organised a ten day field-school, where we received classes in the mornings and went out onto the nearby sea ice in the afternoons. As well as receiving the wisdom of established scientists, the students also spent time networking with and teaching each other.
What is BGC about?
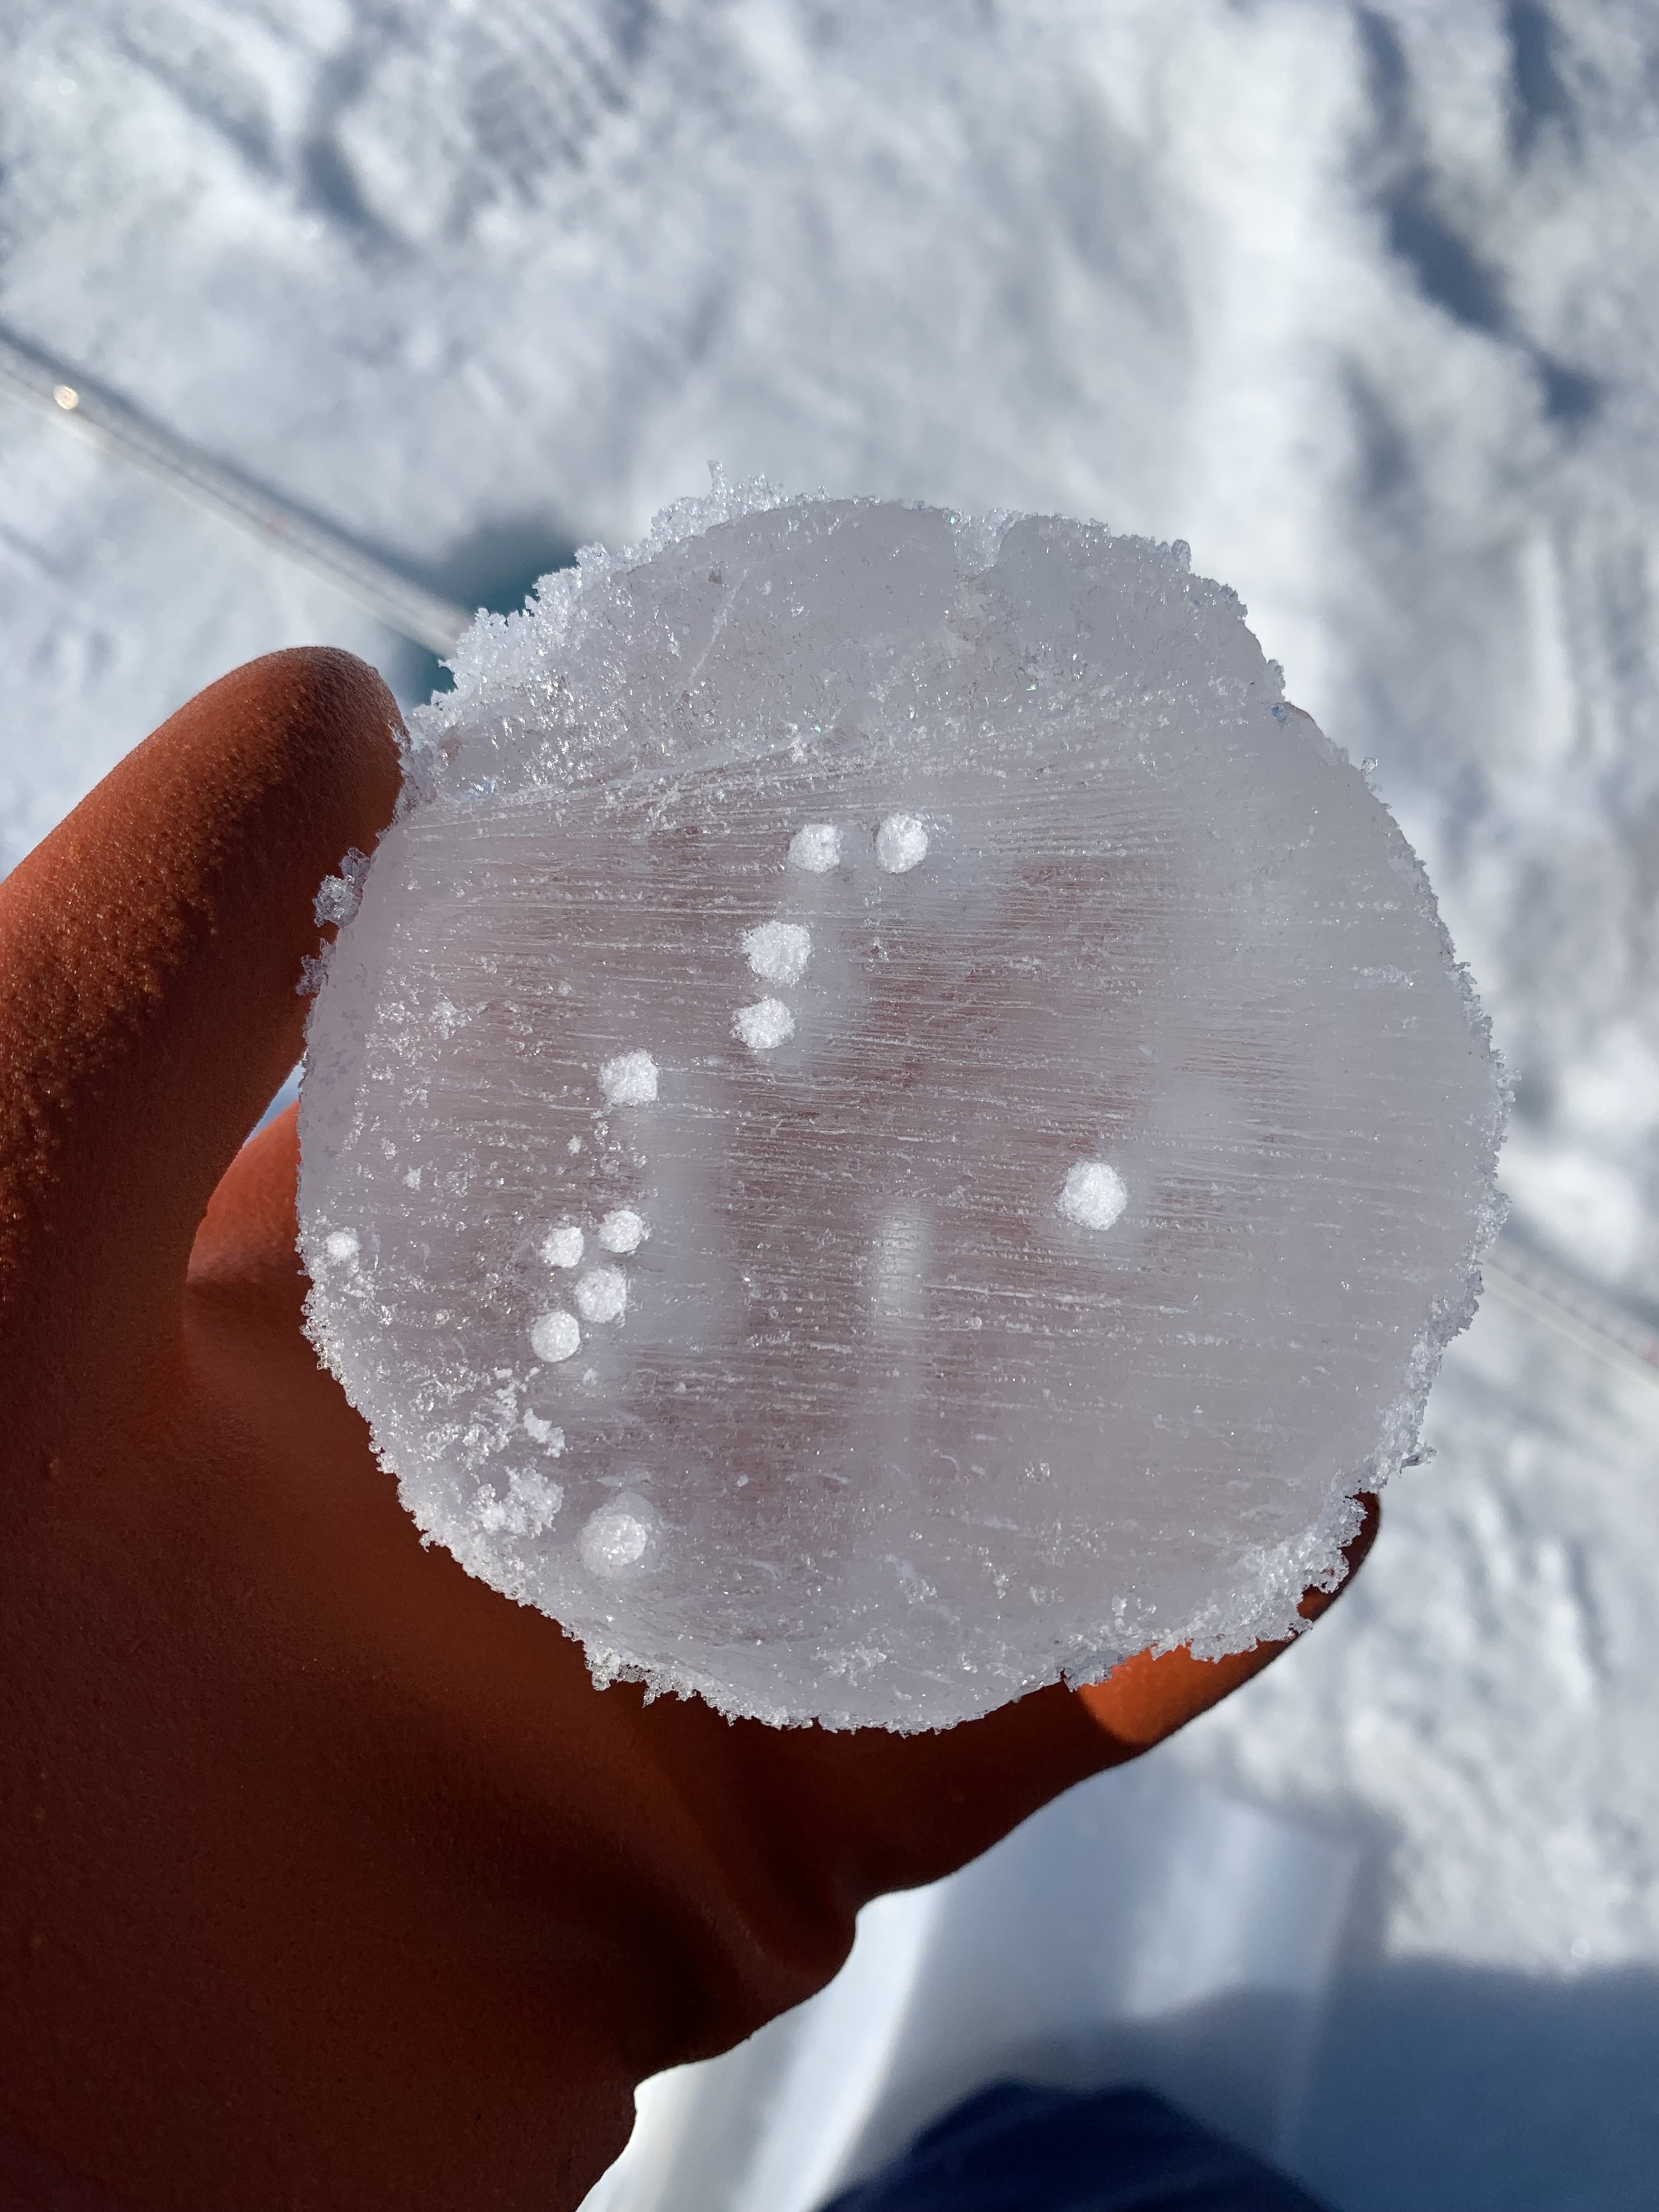
Brine channels (white dots) are visible in a cross section of a sea ice core. These channels allow the vertical flow of gas and nutrients through the ice. They also allow the ice to desalinate over time through brine convection. Photo Georges Kanaan (UW) (@scientificgeo)
Sea ice is a three phase material: it’s made of liquid saltwater, solid ice crystals, and gas bubbles. The relative abundance of those three components dictates its porosity, temperature profile, thermal conductivity, bulk density and its ability to be penetrated by light. The same can also be said for the snow that sits on top! Much of the early teaching-sessions of the course focussed on how to understand the relationships between the physical sea ice variables above.
A separate but related strand of teaching focussed on in-ice algae: how, where and when it grows, and what its effect is on the organisms that depend on it. In-ice algae only makes up a relatively small fraction of Arctic Ocean primary productivity (relative to floating phytoplankton), but it provides a key service because of the timing of its bloom. It can bloom earlier than phytoplankton because it can sustain a position at the ocean surface by dint of being locked in the ice. This means it can sustain grazers that have survived the winter before they can live on phytoplankton.
The final strand (in my subjective subdivision) involved nutrient cycling and gas exchange. Because the polar oceans are relatively cold, they act as excellent solvents for carbon dioxide and nutrients like nitrogen. They also store these materials and nutrients as particulates in suspension. The ocean is full of stuff! However sea ice moderates the cycling of these nutrients and the flux of carbon. That’s because the nutrients are modified by organisms that respond strongly to light, and thus respond strongly to sea ice cover. Sea ice also acts as a porous “cap” on the ocean, that selectively blocks (or even amplifies!) gas exhcnage between the ocean and the atmosphere. This function is in large part determined by the connectivity and abundance of its brine and gas inclusions that I mentioned above.
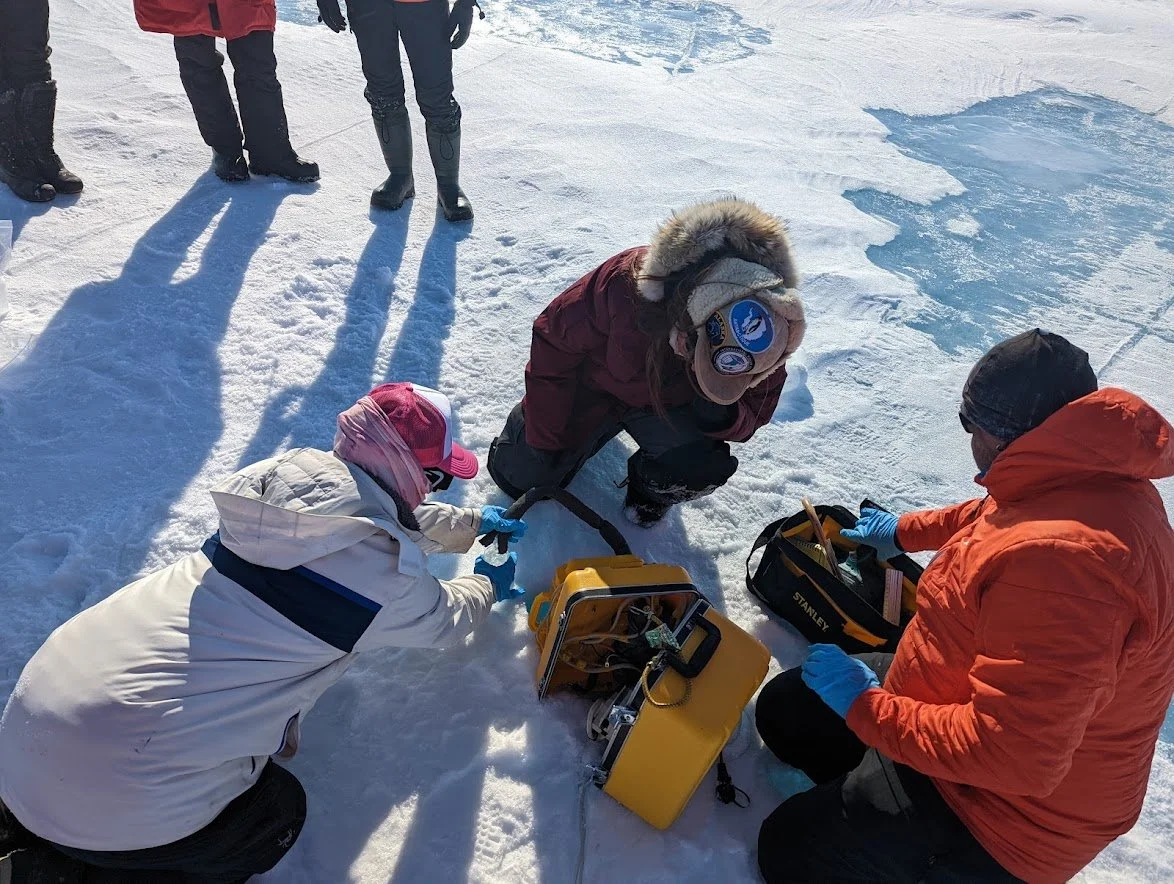
Odile Crabeck and Bruno Delille leading brine sampling with a peristaltic pump. When a ‘sack hole’ is drilled part-way through the ice, it fills with brine which seeps in due to ice porosity. This can be pumped out into bottles using a pump.
Going on the sea ice
Our accommodation was right next to the sea ice, so we were able to go out and walk around on it almost every day, with the added benefit of 24/7 daylight. In the afternoons we went out with the lecturers and scientific equipment. To measure the brine volume fractions we drilled sea ice cores and then immediately measured their temperature profiles. We then sawed up the cores in 5 cm segments, and melted them back in the lab. We then measured the bulk salinity of these samples. Knowing the bulk salinity and the temperature profiles allowed us to model the brine volume fraction and the salinity of the brine inclusions. We also spent time measuring the optical properties of the snow and sea ice. This involves using a radiometer to measure the incoming sunlight, the sunlight reflected from the ice, and then positioning the radiometer under the ice and measuring the amount of light that penetrated through.
Overall I spent twelve days in Cambridge Bay and had a great time. I learned a lot about BGC and it was super-interesting to see melt onset occur in person. It was also really cool to learn about everyone else’s projects; I’m sure we’ll collaborate some day. I’m grateful to IASC for paying for my participation, and for BEPSII for organising the school. But especially I’m thankful to all the lecturers who often took time out of their actual fieldwork campaign to teach us both in the classroom and the field.
One rider in the snowmobile races, which are part of the annual Frolics Week in Cambridge Bay. We were lucky that the BEPSII school coincided with this week! This race was a time trial, but there were also head-to-head drag races and a hill climb event.