This is a blog-version of a talk I’ll be giving next month on the main stage at the RGS Explore Festival. I’m heavily reliant on the amazing photos taken by Clement Soriot at U. Manitoba.
It’s more important to monitor sea ice than ever. The world and the Arctic are warming at record rates, and sea ice in both hemispheres is in retreat. How can we characterise these changes and be ready for what comes next? Given the size of the Arctic and how difficult the conditions are to work in, satellites are the only real answer.
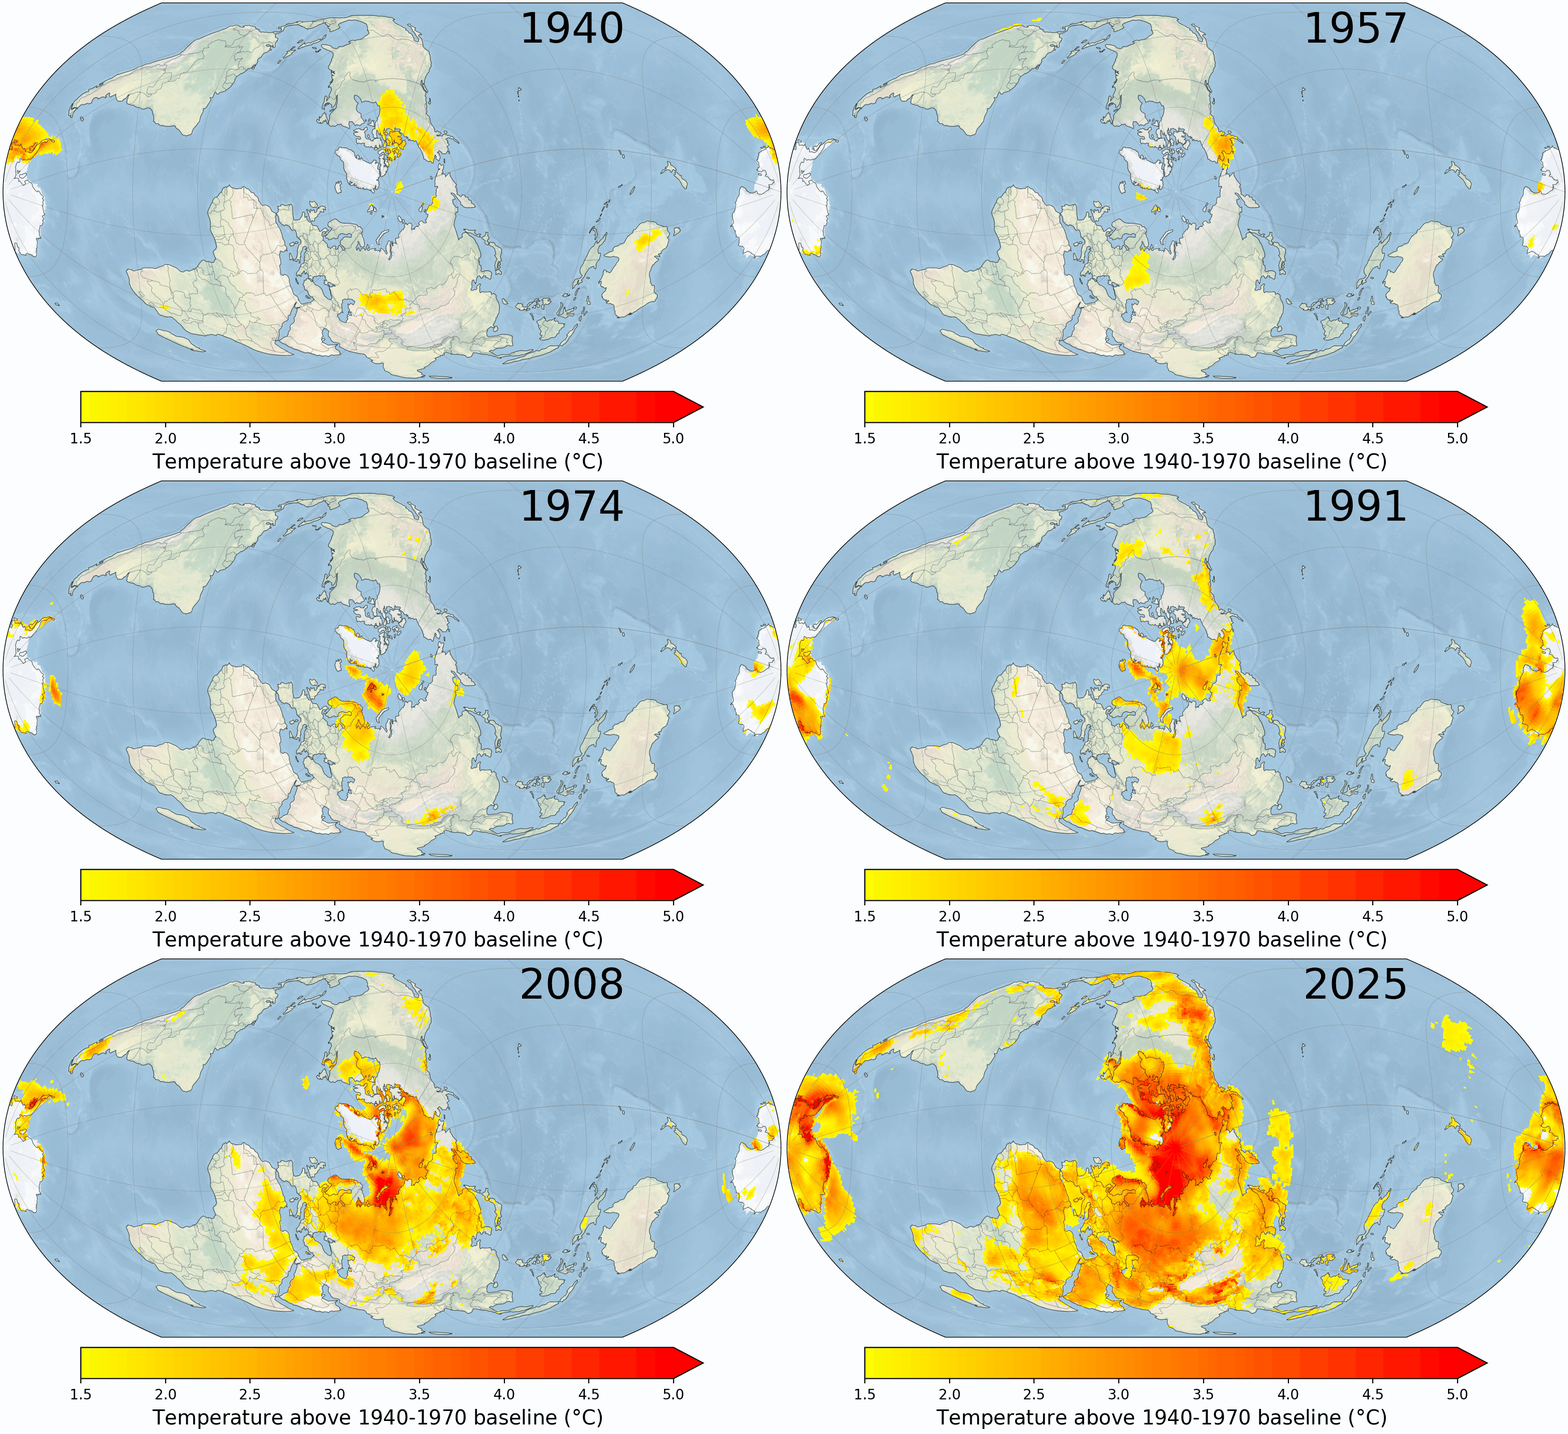
The climate crisis figure: areas of the world that have exceeded 1.5 degrees of global warming every year.
But how do we use satellites to monitor more than sea ice extent? We’d like to see from space how thick it is, how thick the snow is, if it’s melting or if it’s frozen. There’s no way to do this just by taking photos from space: most of the time it’s either cloudy or dark. Luckily, we have a lot of radar data to play with. Radar waves illuminate the polar regions at different frequencies and from different angles several times per day.
In fact, the European Space Agency is launching even more radar missions! CRISTAL (a radar altimeter) and ROSE-L (an imaging mission) will go up in the next few years. It’s also launching a radiometer, which doesn’t emit radar waves but does measure the naturally emitted microwaves from the Earth’s surface to tell us about what’s going on. These are “Expansion Missions” to the EU’s Copernicus programme.
So we have a lot of data, but we can’t always interpet what we’re seeing. Imagine a black-and-white image of your street taken from an airplane - looking at the photo, would you be able to tell if it’s raining? If it’s noon or twilight? What time of year is it? Is that litter on the ground or are they leaves? This is the style of investigation we do with radar data, but instead we’re looking for the sea ice properties, not the conditions in the street.
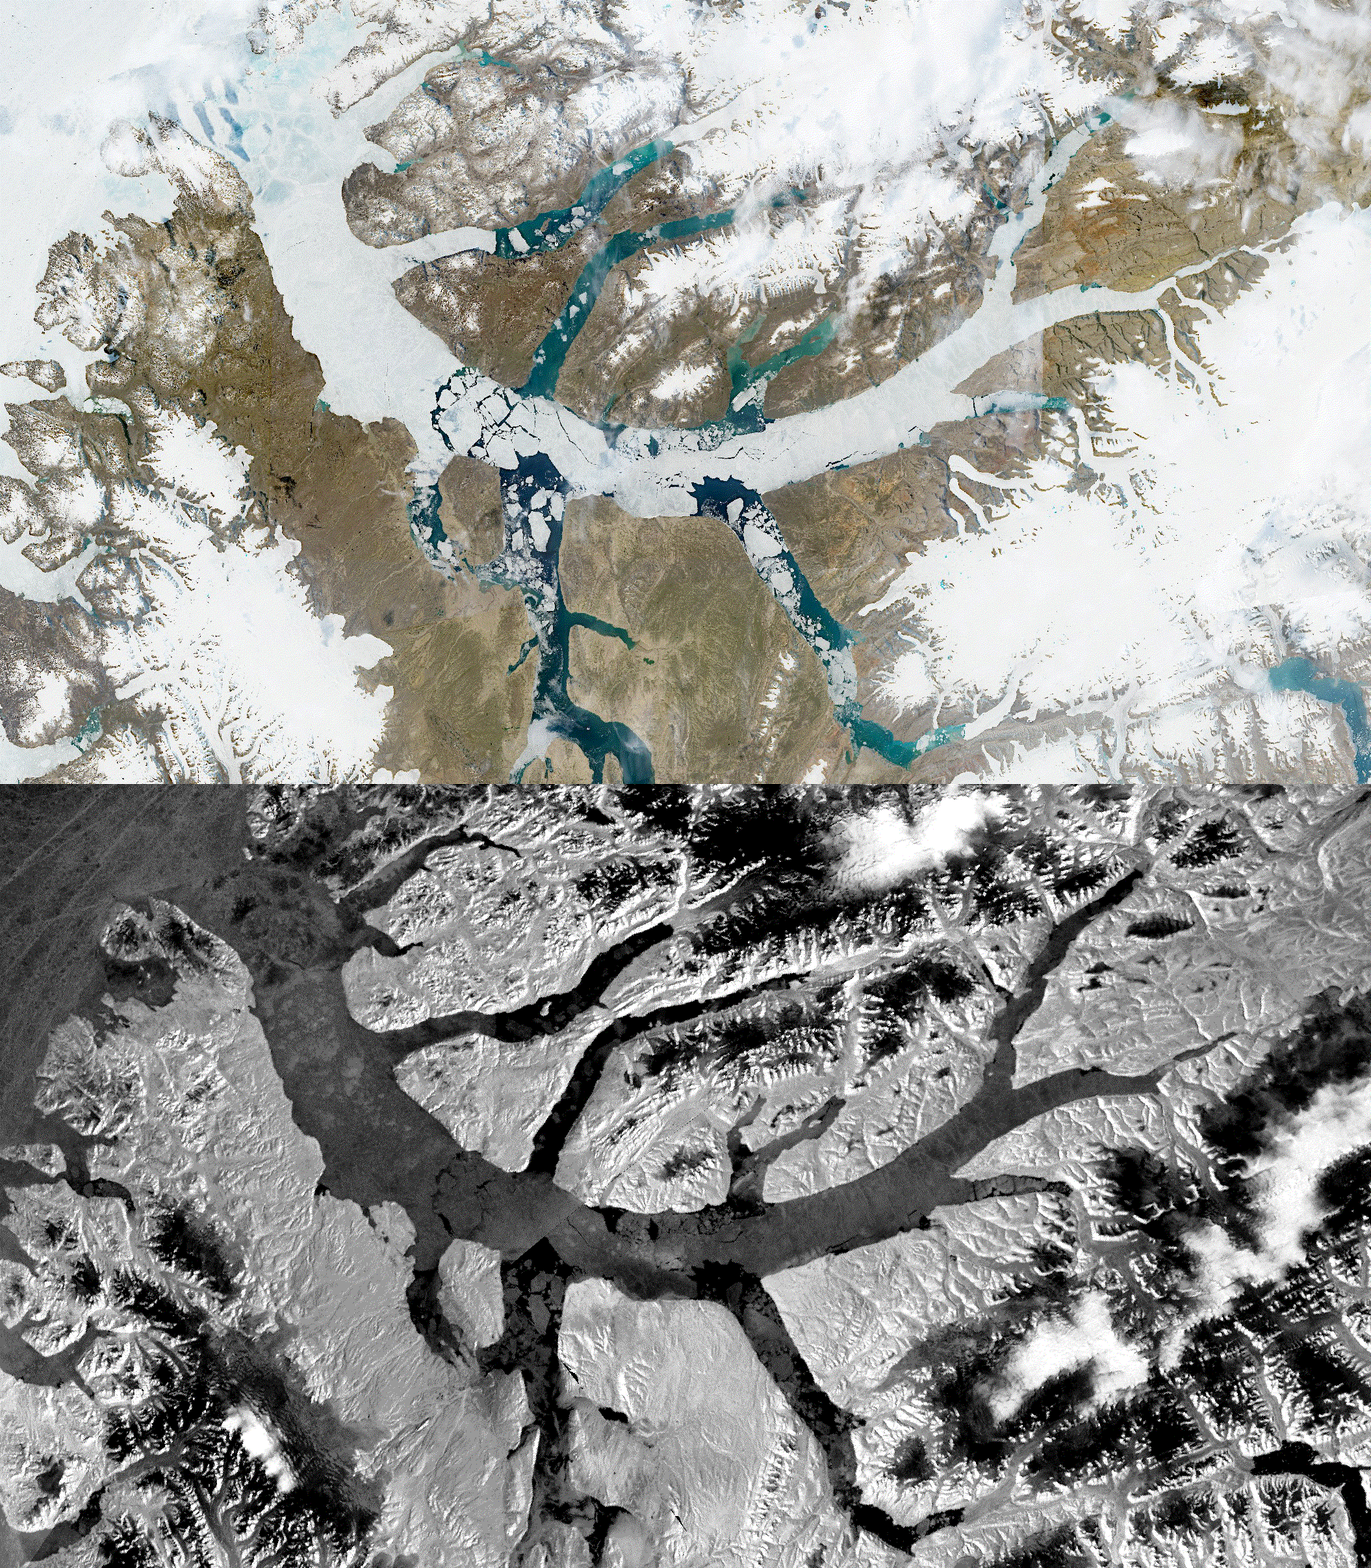
What can you learn from this optical vs radar image of Nansen Sound in northern Canada?
Enter the Copernicus Expansion Missions Sea Ice Experiment: CEMSIE. It was a two month experiment in the Canadian Arctic with a bunch of radars, both on the sea ice and in aircraft. The mission was to grab as much radar data as possible of snow and sea ice that were as well characterised as possible. At the risk of oversimplifying, we can now compare the radar data to the physical measurements and see what physical properties are driving what radar signals. Simple! Right?
Given the infrastructure of the field campaign, the number of hi-tech instruments gathered for it, and the fact that lots of satellite data was collected specially for the project, it also made sense to bolt on a bunch of other opportunistic science. This is actually how I was funded to go - I pitched a snow-science project to the UK Royal Geographical Society and was given their annual Walters Kundert Fellowship to do alongside CEMSIE. My fellowship involves further developing methods for isotopic tracing of brine movement from sea ice into snow.
Going back to the “main” CEMSIE work, it had two major prongs: in-situ scatterometry and airborne measurement. By “in-situ scatterometry”, I mean a number of sled- or scaffolding-mounted radars that scanned the snow at regular intervals. These were operated from a field camp about ten kilometers out into Dease Strait near the town of Cambridge Bay. At the camp we had two tents, one for gear storage and one that allowed use to sleep overnight in shifts. We used the Canadian High Arctic Research Station (CHARS) as our base in Cambridge Bay, and the field site was held together by Gab Ferland from Viventem Guiding. If you ever get a chance to work with him then you should take it.
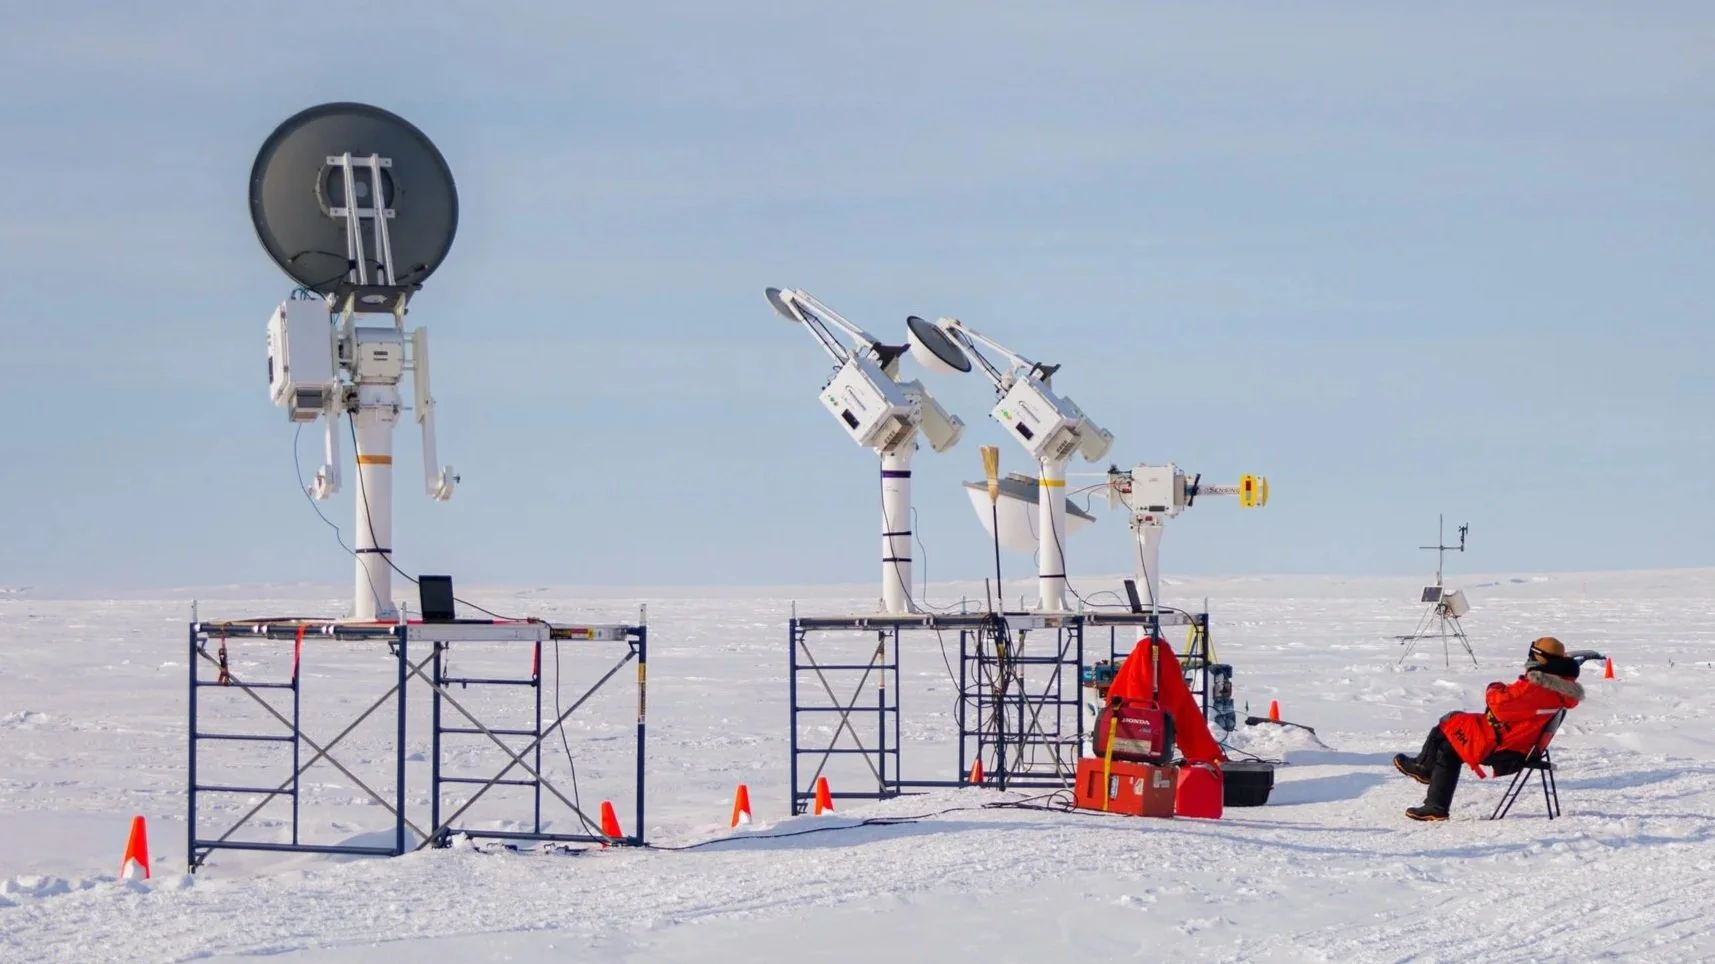
The CEMSIE scatterometers, supervised by Vishnu Nandan. Photo by Clement Soriot.
The airborne measurements were conducted by three planes: one carrying the CRISTALair simulator, another carrying the EM-Bird and CryoSAR system, and a nasa aircraft carrying a nadir-looking radiometer and CRISTAL-air-like instrument. We used a helicopter from Great Slave Helicopters - shout out to Robin for his consummate professionalism and for always keeping us safe. Although we had very high quality measurements at our field camp where the scatterometers were, we used the helicopter to get out to key sites under the aircraft tracks and provide ground-truth for their measurements. In turn, the aircraft tracks were underneath the tracks of the corresponding satellites. So we often have measurements of the snow and sea ice at the surface, from planes and from space. Neat stuff.
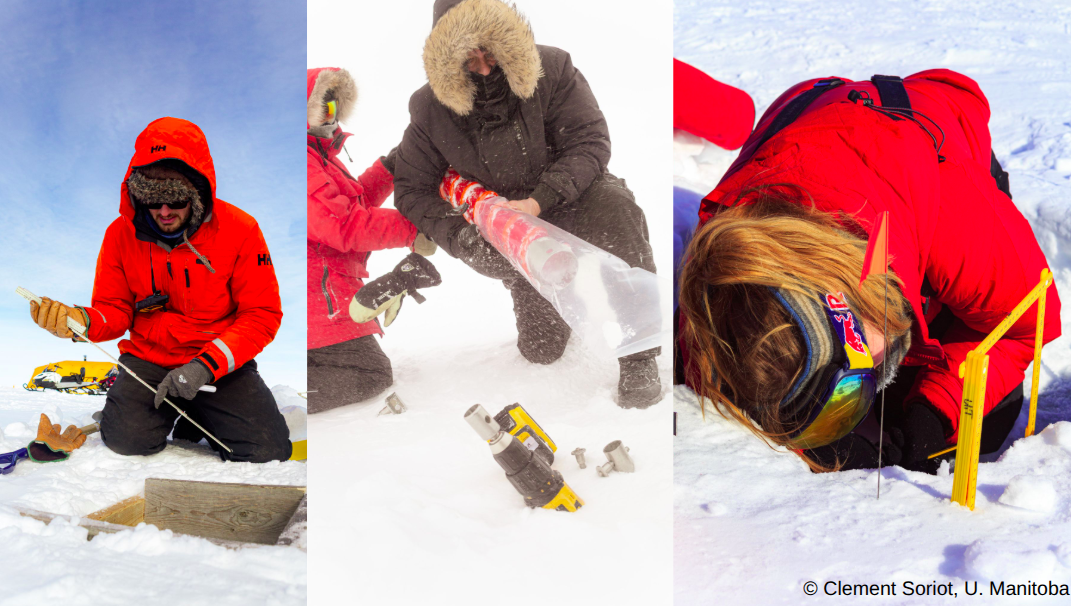
In-situ measurements of snow and ice during CEMSIE. On the left I’m measuring the characteristics of the snow being used for my isotopes project. Centre is John Yackel putting an ice core into a bag. Right is Renée Fredensborg Hansen characterising snow stratigraphy.
Alongside my snow-physics and isotopes experiment funded by the RGS, my role was also to set up a remote calibration site. I should stress that this was a big team effort - it wasn’t just me going out there. Over several days we set up a corner reflector (visible to all three aircraft and potentially even satellites) and a bunch of oceanographic instruments to measure fluctuations in the tides. We also characterised the snow properties and ice thickness particularly well at the site.
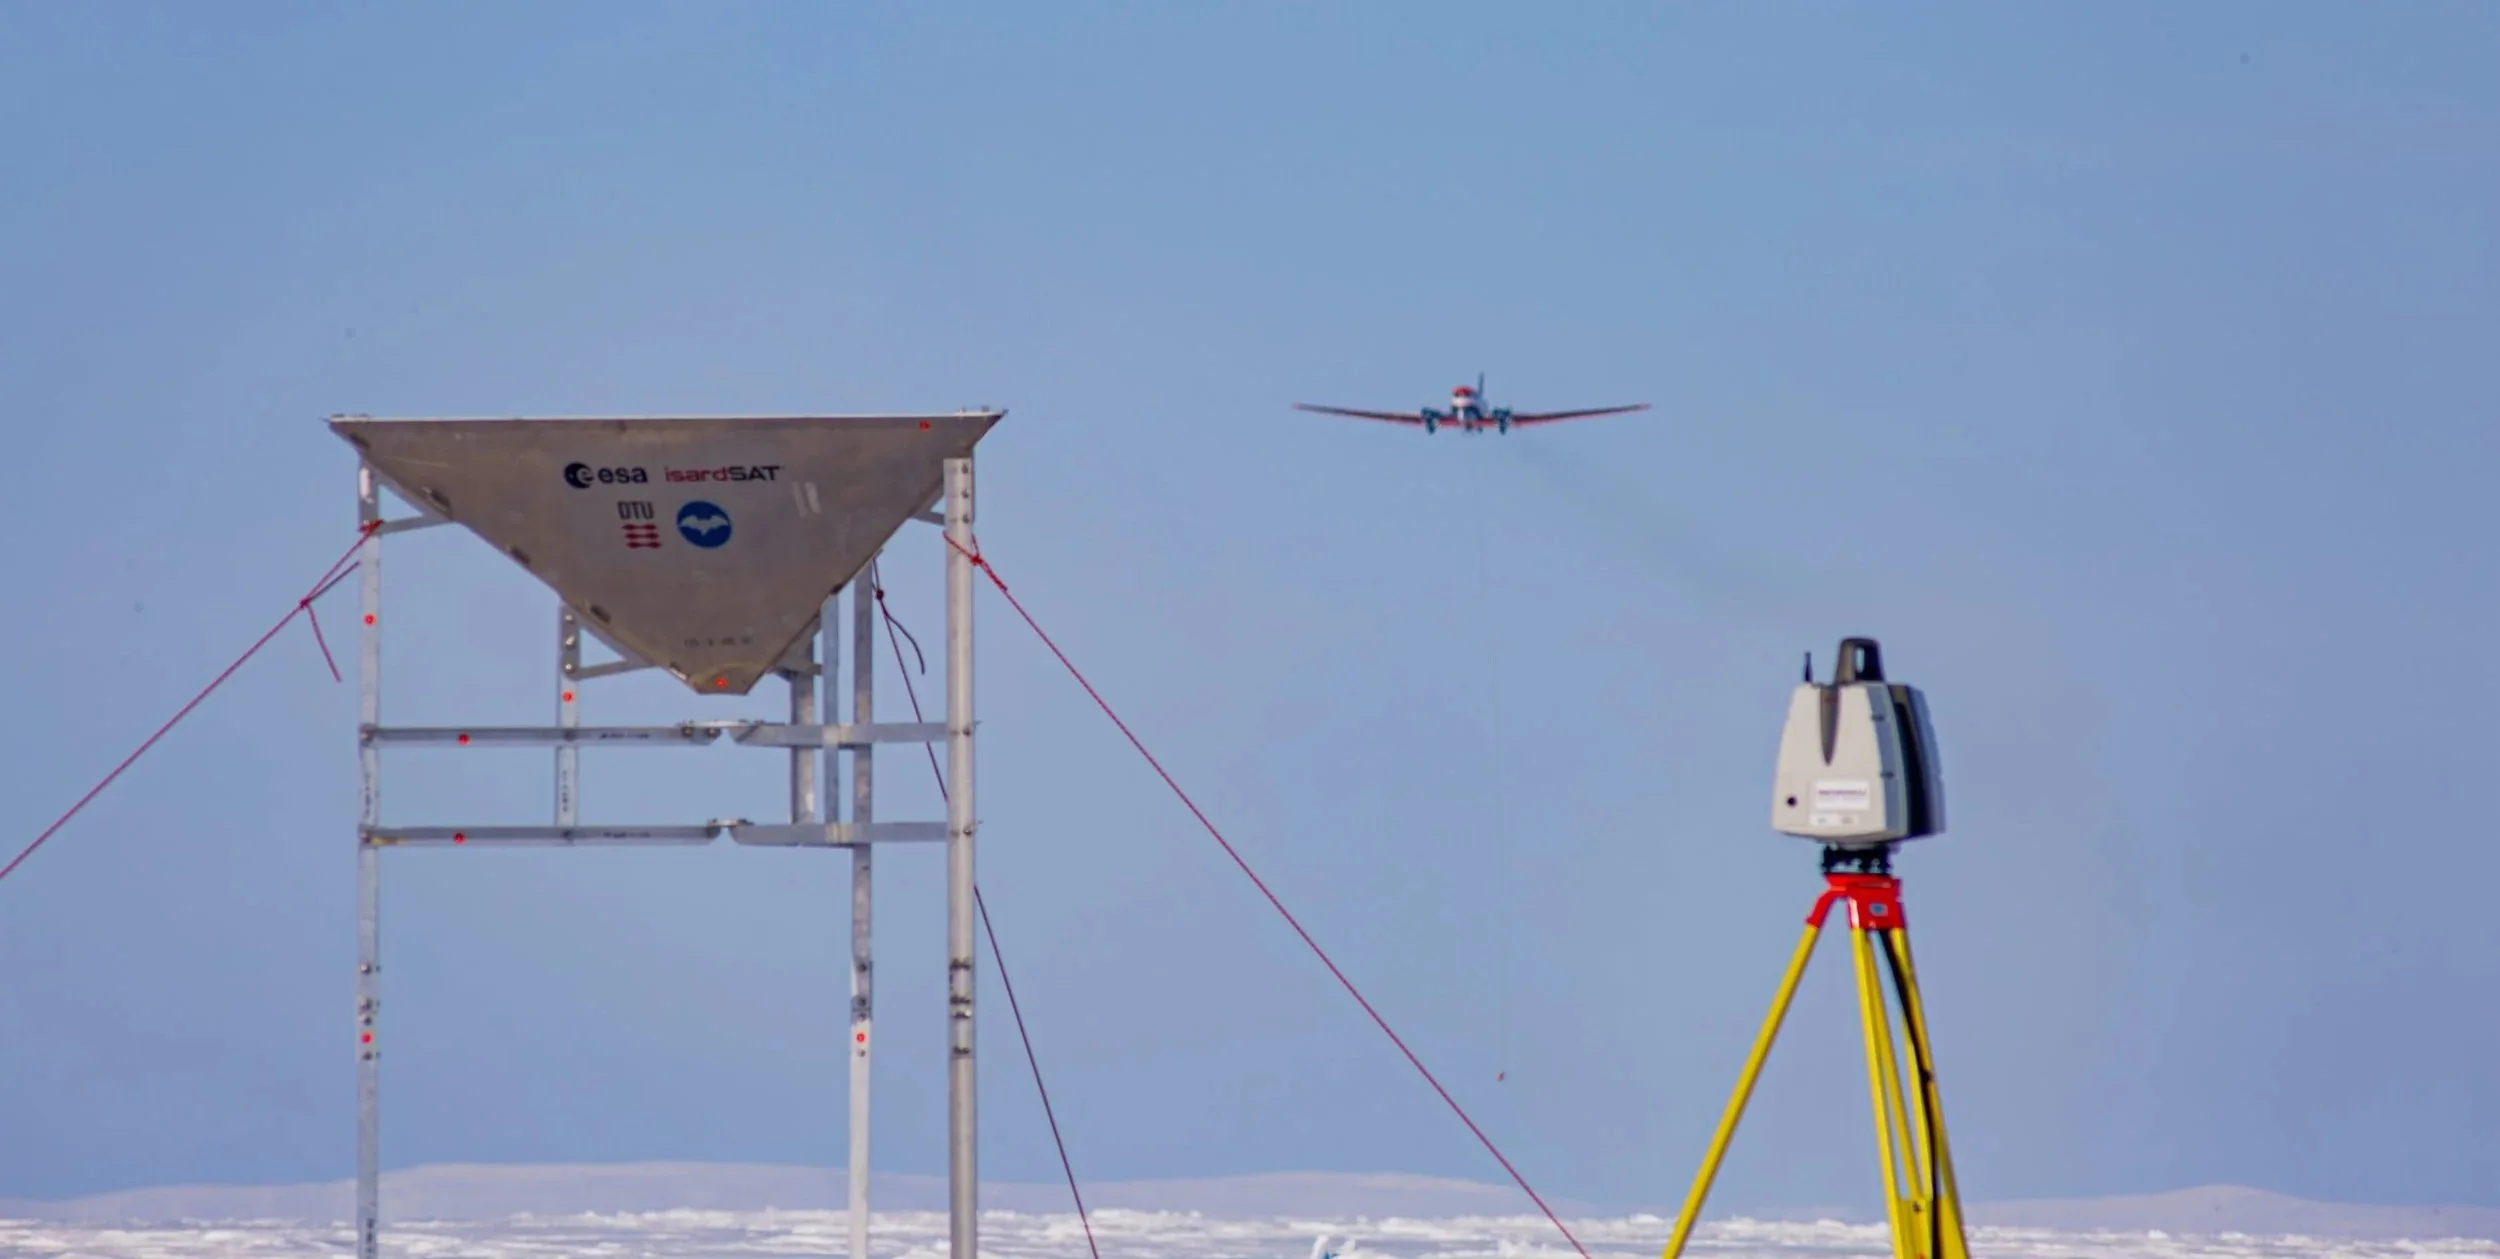
AWI’s aircraft carrying its IceBird instruments as well as CRYOSar as it’s about to fly over our corner reflector site. Photo by Clement Soriot at U. Manitoba.
CEMSIE was one of the larger team efforts I’ve been involved with. Although I’ve been “in” larger teams (i.e. research cruises), this team had to work particularly closely together and our objectives were more shared than usual. It was great to experience this, and there was a great vibe in the team. This was particularly the case during the 10-day airborne phase which was extremely busy and at times high pressure. Even though I was exhausted at the end of my month, I was still very sad to leave.
Work is now ongoing to curate, collate and analyse all the data that was collected. This will tip us off as to what the next generation of European polar-monitoring satellites will reveal.
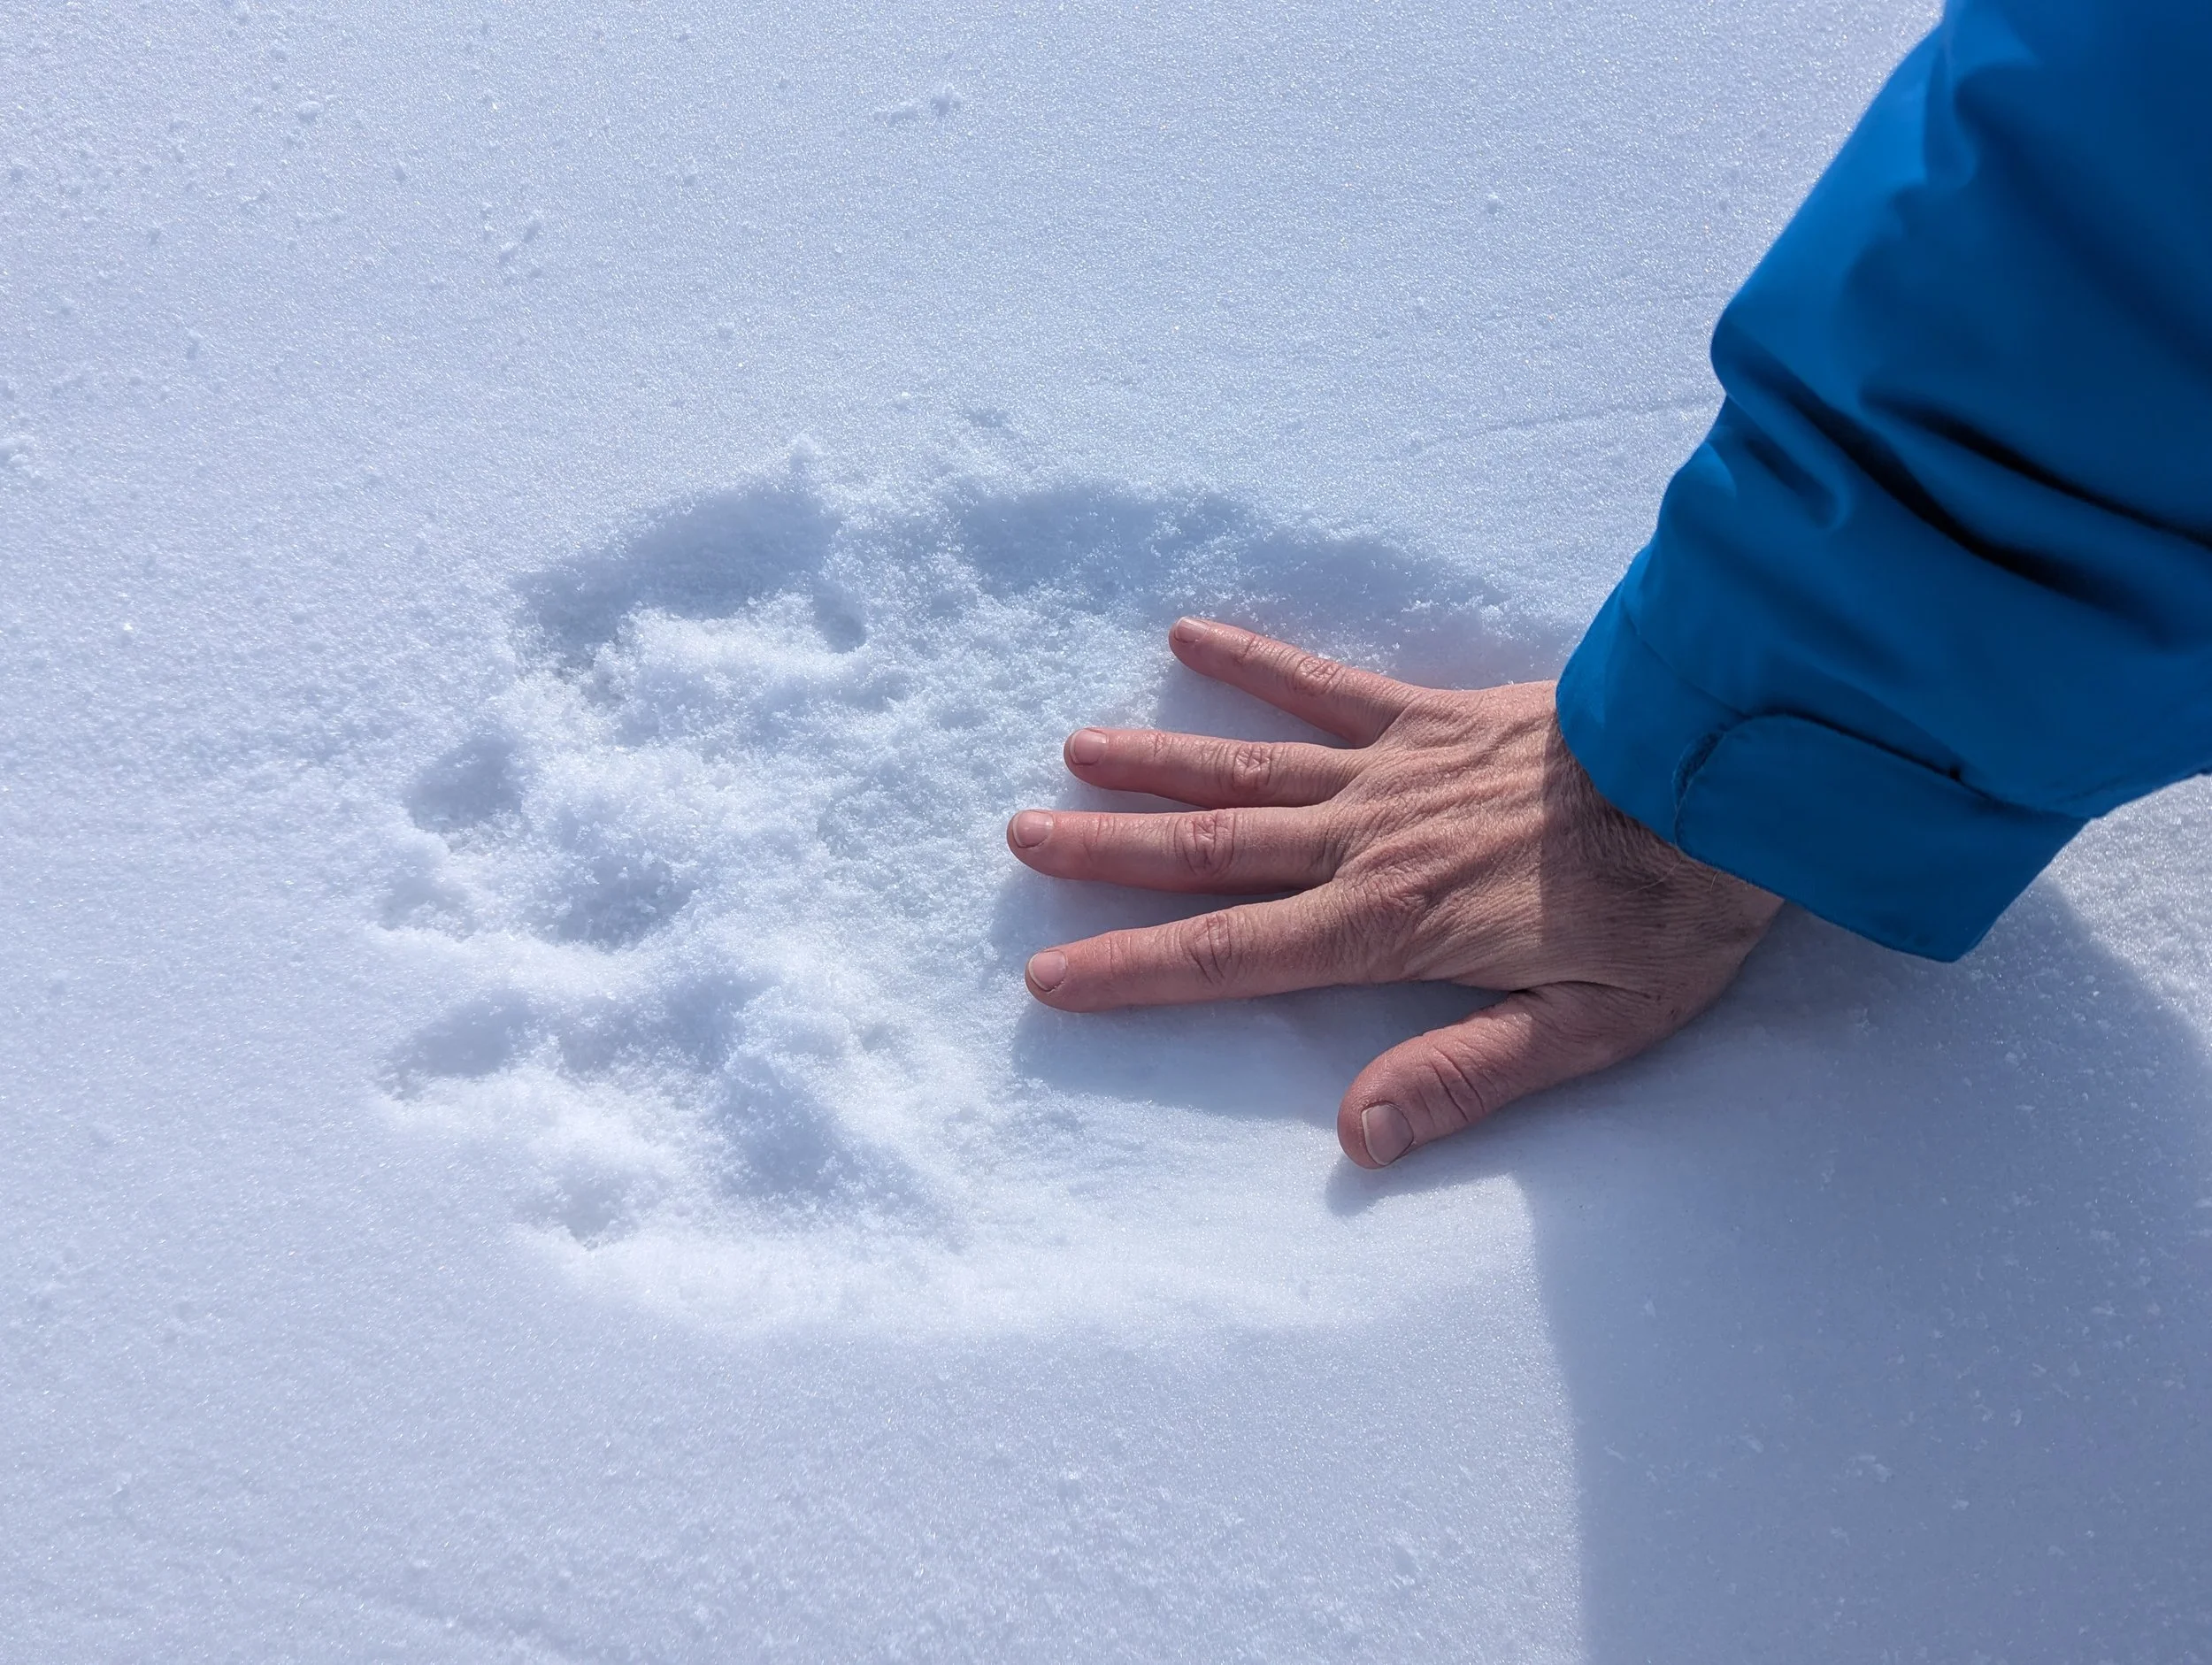
Polar-bear pawprint that we saw on one of our helicopter flights. Photo: Me. Hand model: Tania Casal.